The fact that ventricular fibrillation can be considered as an electrical accident justified standard signal analysis on electrograms during ventricular fibrillation in dogs and patients under different circumstances in order to see whether in this description ventricular fibrillation would emerge as one syndrome or not.
Moreover it seemed fruitful to develop models - based upon accepted theories of cardiac anatomy and electrophysiology - that would describe ventricular fibrillation as emerging from this analysis.
See the Complete text of this chapter.
888 electro(cardio)grams during ventricular fibrillation in dogs with artificial coronary perfusion have been analyzed. Only 15% haved Normally distributed amplitudes. The amplitude histograms are classified in this chapter as unimodal symmetrical, unimodal asymmetrical, rectangular or two-peaked.
The autocorrelation function damped to zero within 2 seconds in 53% of the cases.
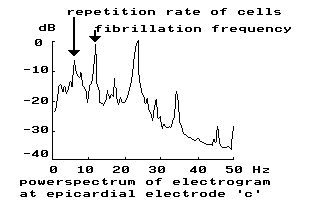
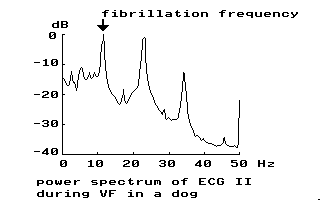
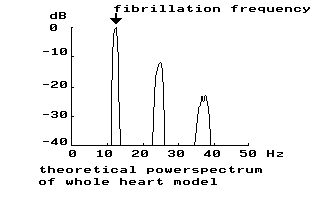
Most of the auto power spectra of electro(cardio)grams during ventricular fibrillation contain equidistant peaks. The basic frequency (defined as the highest peak in the power spectrum) of ventricular fibrillation ranges from 9 to 13 Hz in dogs. In approximately 25% of the spectra clear peaks were seen at half the basic frequency.
The autobicoherency indicated the higher frequencies as true harmonics of the basic fibrillation frequency.
See the Complete text of this chapter.
V. A LOCAL, OSCILLATING MODEL
In this chapter two types of oscillating models are described. The first type of model has been based on the random neuronal networks and models from the field of epidemiology. These model are capable of sustained, rhythmic activity, but never faster than the basic rate of the elements.

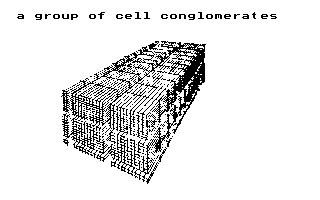
The second type consists of a three-dimensional array of 1000 interconnected cells with the number and kind of connections based upon data from literature. 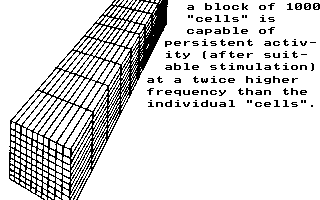
These models also were capable of sustained, periodical activity. The net result of this phenomenon was that the externally recorded activity showed a twice higher repetition frequency than the individual cells.
To get some idea of the 'fibrillation' of this model run the program TOPOLT. To 'see' this block as an oscillator, run 'VFSUM' (mode 1), and the fractal of this oscillator is shown by: 'LTURTLE VF.ECG' .
Download these programs as 'ZIP'-file,
unzip them, read the instructions and run them (only on IBM PC!).
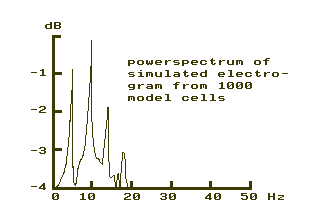
As the groups were not of the same size the power spectrum also contained small peaks at half the apparently basic frequency.
See the Complete text of this chapter.
VI. CONCLUSION ABOUT LOCAL FIBRILLATION
In this chapter the spectra with very narrow, strongly bicoherent peaks are explained as resulting from a regularly repetitive phenomenon measured by the electrodes.
A broader basic peak associated with a breaking up of the higher harmonics in separate peaks points to a summation of signals with slightly different repetition frequencies. This class of signals will show in the time domain the characteristic amplitude pulsation of ventricular fibrillation.
A high irregularity in the repetition will somewhat broaden the basic peak in the auto power spectrum, but the diminishing of the higher harmonics is much more indicative of this type of signal.
See the Complete text of this chapter.
VII. MULTI CHANNEL ANALYSIS
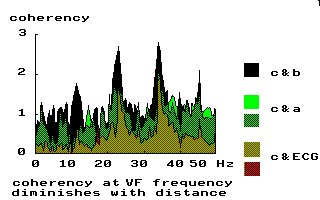
The coherency spectra between electrodes indicated coherent areas during ventricular fibrillation with a size range of smaller than 2 mm to larger than the electrode size. In those cases where several independent coherent areas were seen along the needle electrode, the borders between these areas were not due to anatomical features, but shifted in the course of time. The cross phase spectra were used to estimate time differences within coherent areas.
No propagation of a wave front was found, as there was no linear dependence between the phase difference at the basic frequency and the phase differences at the higher harmonics. The change of the cross phase in course of time indicate how areas under adjacent electrodes can first oscillate with a frequency difference of approximately 0.01 Hz and than suddenly get synchronized.
An explanation is given with the help of the models of the previous chapters.
See the Complete text of this chapter.
VIII WEAKLY COUPLED RELAXATION OSCILLATORS
At the cellular level the behaviour of a model of small groups of strongly connected cells during ventricular fibrillation (chapter V) fulfils the formal requirements of relaxation oscillators, so the conclusions from literature about weakly coupled relaxation oscillators can be applied to ventricular fibrillation.
Important analogies between the observations and the literature found are: the slow movement of the borders between coherent areas, partial frequency entrainment rather than synchrony and consequently pseudowaves instead of conduction of the action potential.
Run a simulation with 'VFSUM' (mode 2) Download this program as 'ZIP'-file,
unzip them, read the instructions and run them (only on IBM PC!).
See the Complete text of this chapter.
IX. CONCLUSION ABOUT LARGE-SCALE FIBRILLATION
The dispersion in refractory period will lead to an apparent fibrillation frequency of 11 - 13 Hz if one assumes a mean repetition period of 6 Hz. The findings of chapter VII are strongly reminiscent of weakly coupled relaxation oscillators; anti-phase mode, partial entrainment, etc. Pseudowaves (or: optical illusions) are more likely than real, travelling waves during ventricular fibrillation.
Run a simulation with 'PSEUDWAV' Download this program as 'ZIP'-file,
unzip them, read the instructions and run them (only on IBM PC!).
See the Complete text of this chapter.
X. FREQUENCY ANALYSIS OF THE ECG DURING VENTRICULAR FIBRILLATION WITHOUT ARTIFICIAL CORONARY PERFUSION
 As expected the frequency analysis of ventricular fibrillation in dogs without coronary perfusion indicated a non-stationary signal, contrary to the results described in chapter IV. At the onset of fibrillation however the same type of spectrum was found as in the stable situation. The results of signal analysis of the ECG during ventricular fibrillation in patients are, apart from a lower fibrillation frequency, in accordance with the results from the experiments in dogs and the models as described in the previous chapters. The most striking conformity with the model developed in chapter V was shown in a coronary care patient, whose tachycardia developed into ventricular fibrillation with a frequency twice that of the tachycardia, while that lower frequency was still clearly distinguishable in the spectrum during ventricular fibrillation.
See the Complete text of this chapter.
Complete stop of coronary flow during ventricular fibrillation did alter the spectra considerably, but restoring the flow gave rise again of the same ventricular fibrillation. Ligation of the left ascending artery did not change the spectra significantly.
A tricyclic anti-depressant slowed ventricular fibrillation and brought ultimately the heart in asystole, which was followed by a sinus rhythm.
The transition from stimulated tachycardia into ventricular fibrillation confirmed the theory of this study, that ventricular fibrillation is a double tachycardia.
See the Complete text of this chapter.
XII. MATHEMATICAL CONCLUSION
In a more or less anecdotal introduction the importance of awareness of theories and models is sketched. What is a relevant observation and what not? what is an erroneous result and what not? The answers to these questions depend upon one's basic philosophy of science.
The four levels of the model of ventricular fibrillation are described.
At last the whole study can be summarized in a few formulas.